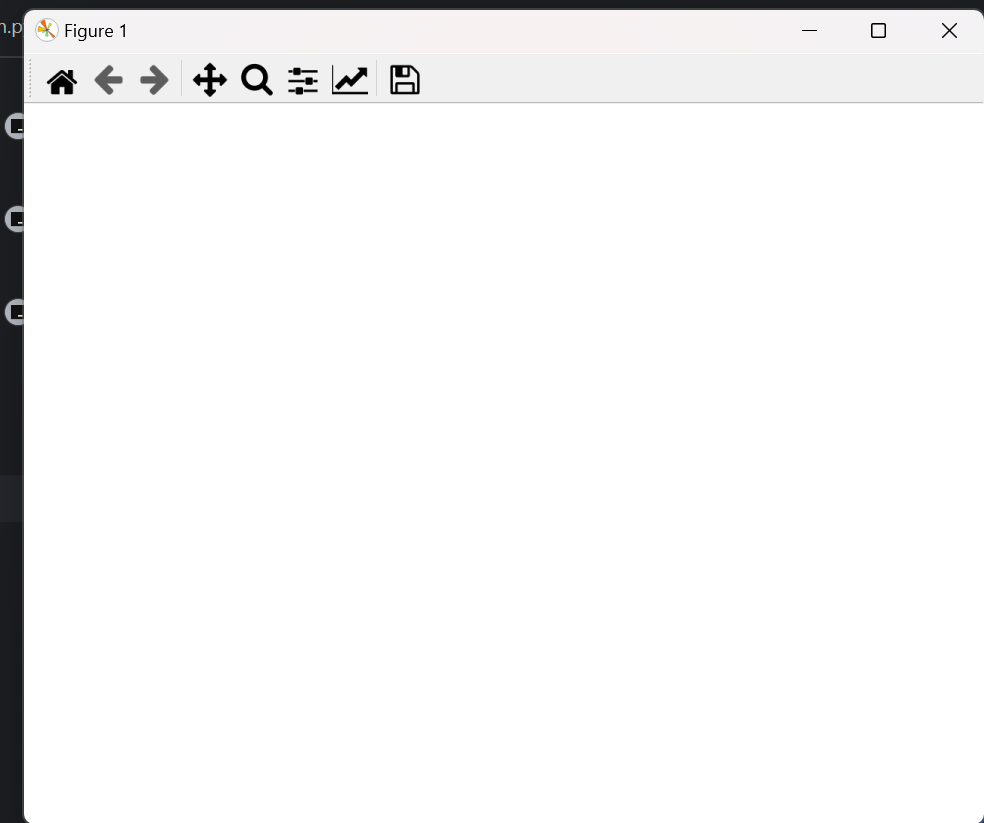
绘制没显示

来自课程:人工智能中的数学基础(Python)
import matplotlib.pyplot as plt
from mpl_toolkits.mplot3d import Axes3D
import numpy as np

def PxFun(x, y):
    return 1 + 4*x + 2*y
def PyFun(x, y):
    return 1 - 2*x + 4*y
def Fun(x, y):
    return x-y+2*x*x+2*x*y+y*y

fig = plt.figure()
ax = Axes3D(fig)
X, Y = np.mgrid[-2:2:40j, -2:2:40j]
Z = Fun(X, Y)
ax.plot_surface(X, Y, Z, rstride=1, cstride=1, cmap="rainbow")
ax.set_xlabel("x")
ax.set_ylabel("y")
ax.set_zlabel("z")
plt.show()